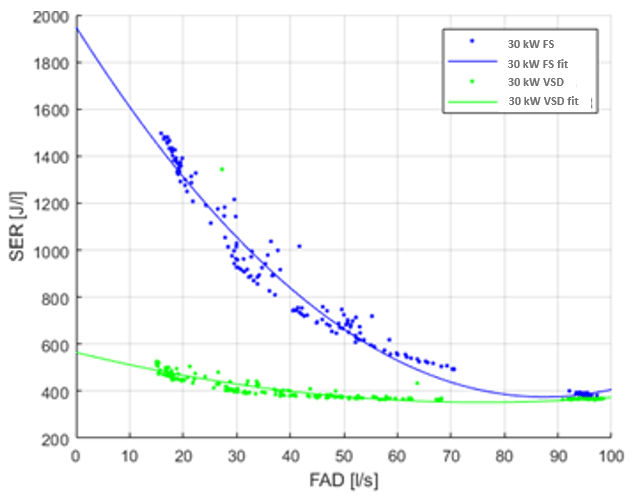
However, due to factors such as load/unload cycles and idle power, the actual SER graph for fixed-speed machines follows a curve.
To assess and compare the performance of our 30 kW fixed speed compressor and our 30 kW variable speed compressor, we conducted a laboratory test. The resulting graph from the study is displayed below. The blue line represents the Total SER of the 30 kW fixed speed compressor, which consistently remains higher than the green line indicating the SER of the 30 kW variable speed compressor.